Building visual literacy skills strengthens teams to create effective data products.
Accenture Visual Literacy Program
Up-skilled Accenture’s Advanced Analytics group by establishing a community of practice
Objective
Generate excitement and inspire a global team to learn new skills so Accenture could remain competitive in rapidly advancing technology market.
Key Activities
Collaborated closely with leadership to understand business objectives and translate them into the program vision.
Researched data visualization thought leadership, design principles, and state-of-the-art techniques
Developed a learning program of 3 online courses, hands-on workshops and a community of practice to build and share knowledge.
Traveled globally to India, Greece, Spain and the Philippines to meet the distributed analytics teams, lead “Train the Trainer”workshops, and encourage participation in the community of practice.
Developed an outreach program, including brown bag lunches, office hours, and creative challenges, for post-trip community care and feeding.
Outcomes
The Data Visualization Community of Practice is now at ~30K members and growing.
The program is required learning for all new Advanced Analytics employees.
Teams in Manila and India successfully applied course knowledge as they transitioned from PPT-based reporting to Tableau-generated dashboards.
The Visual Literacy Program was white-listed and customized for Accenture clients to extend learning with key partners.
I co-wrote and designed three online modules that explain how to create accurate data visualizations that efficiently communicate business data, referencing work from experts such as Edward Tufte, Nathan Yau, and Manuel Lima.
The courses also explore fundamental concepts in human perception, and how to apply this understanding to continually bring excellence to designed experiences.
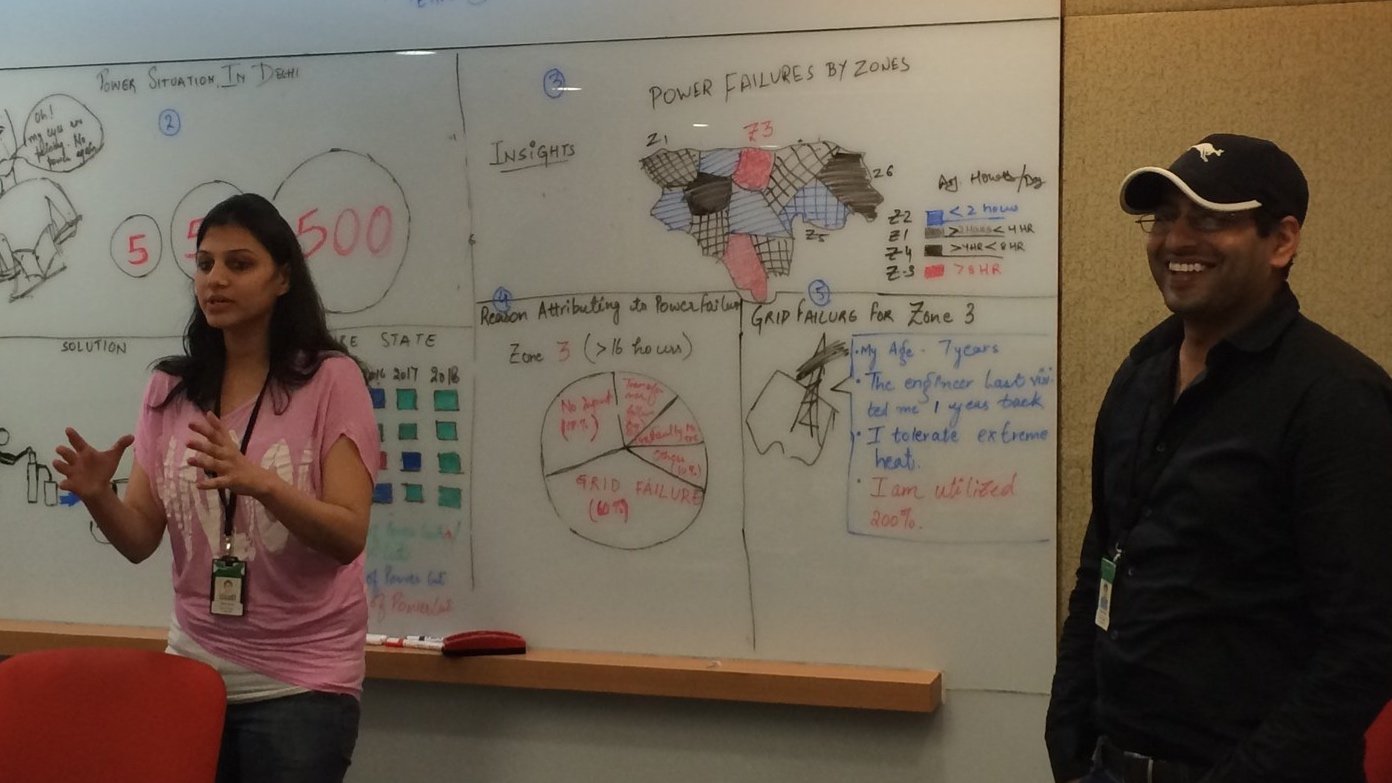
We incubated an in-person workshop that reviewed the highlights of the online courses through practical, hands-on exercises.
I traveled globally and facilitated these workshops, building a community of practitioners, encouraging participatory design processes, and developing a learning culture for the Advanced Analytics teams.
Sketching is the fastest way to get ideas out of our heads and into the real world. We designed custom data visualization sketchbooks with stencils to help practitioners sketch their ideas quickly. Dot matrix graph paper ftw.
This data visualization community has grown by 300% since the launch of the visual literacy curriculum. Accenture’s workforce applies fundamental design skills to visualizations created in Tableau, Qlik and D3, they continue to share and collaborate in this online community.


